In today’s fast-paced manufacturing environments, every second between uncovering an insight and acting on it matters. That’s why the latest TrendMiner 2025.R1.0 release focuses on reducing decision-making latency, making it faster and easier for industrial teams to extract insights and drive decisions with confidence. This update enhances efficiency, clarity, and simplicity across the analytics experience. From space-efficient dashboards that keep critical insights front and center to a better view of event data in Event Analytics that makes analysis more intuitive, these updates are designed to streamline workflows and eliminate friction. With the overall simplification of how data is presented, more people are empowered to be in control, spending less time navigating complexity and more time uncovering value.

Key Features of TrendMiner 2025.R1.0
- Space-Efficient Dashboards: Redesigned tiles and customizable settings put critical insights front and center.
- Enhanced Context Item Search in TrendHub: Search, modify, and create context views seamlessly without switching between hubs.
- ConfigHub in the Hub Switcher: Faster access to system administration tools for a smoother workflow.
- Optimized Connector Ecosystem: Faster indexing, improved authentication, and more flexibility with Wonderware tag retrieval.
Previous Release: TrendMiner 2024.R3.1
While not a major release, TrendMiner 2024.R3.1 included valuable enhancements to Event Analytics and table functionalities:
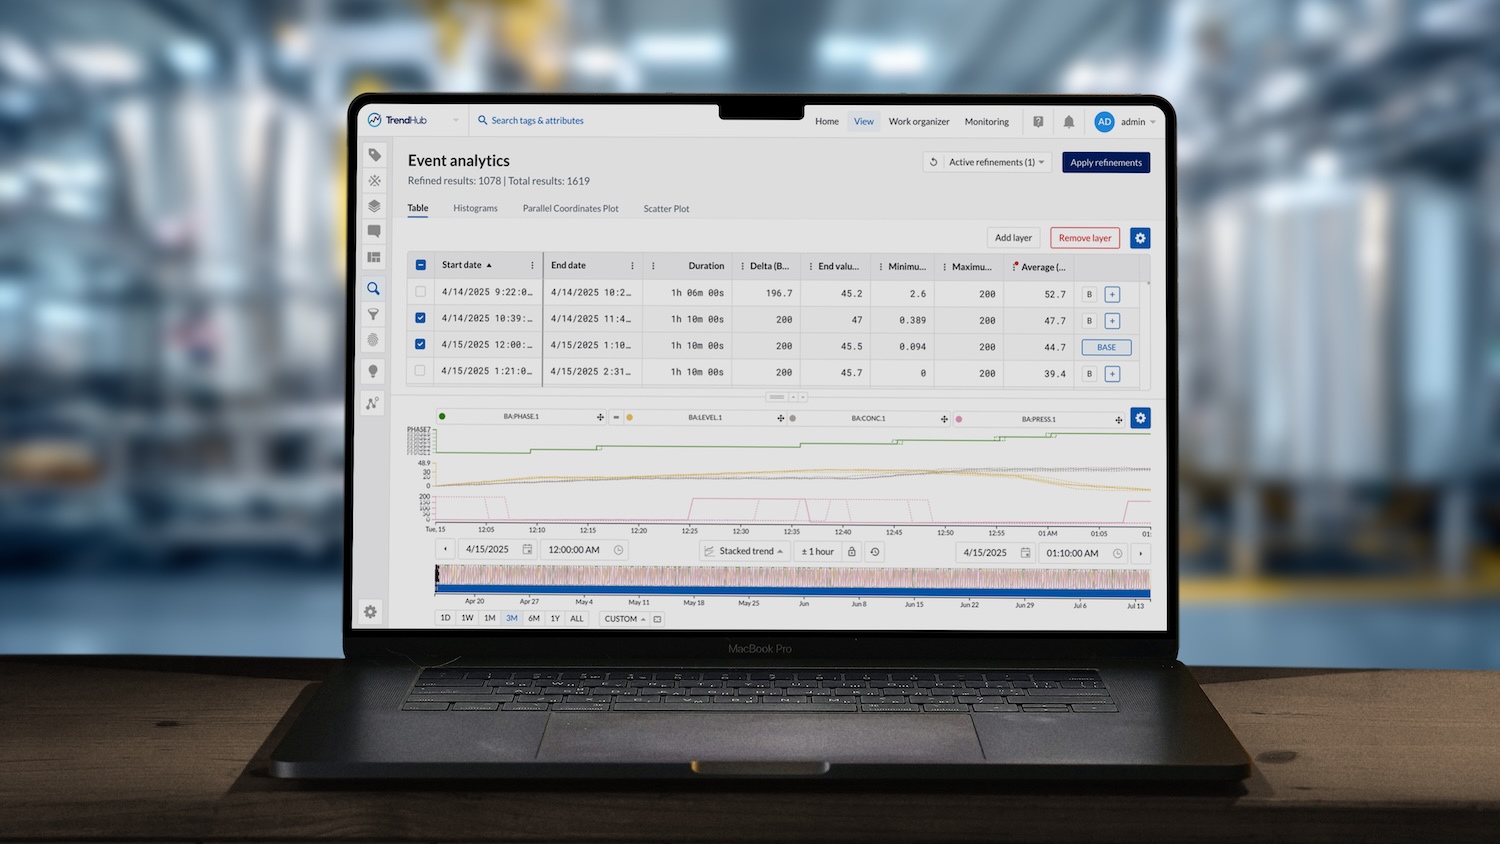
- Table in Event Analytics: Event Analytics now supports a table view, providing users with full visibility of all calculations on search results simultaneously. Refinements on calculations are configurable from this view and carry between all Event Analytics visualizations.
- Event Analytics Extensions: The scatter plot in Event Analytics now offers the possibility to color results based on a string value. In addition, start and end date have been added as additional properties, allowing users to visualize drift and step changes in calculated properties. It is also now possible to limit the properties that are visualized on the different event analytics tabs.
- Table Redesign: This release redesigns tables across the platform to improve readability, streamline options, and enhance user experience with features like adjustable density and sticky columns.
Ready to experience the new features?
Learn more in the upcoming webinar.