Share with a co-worker

Situation
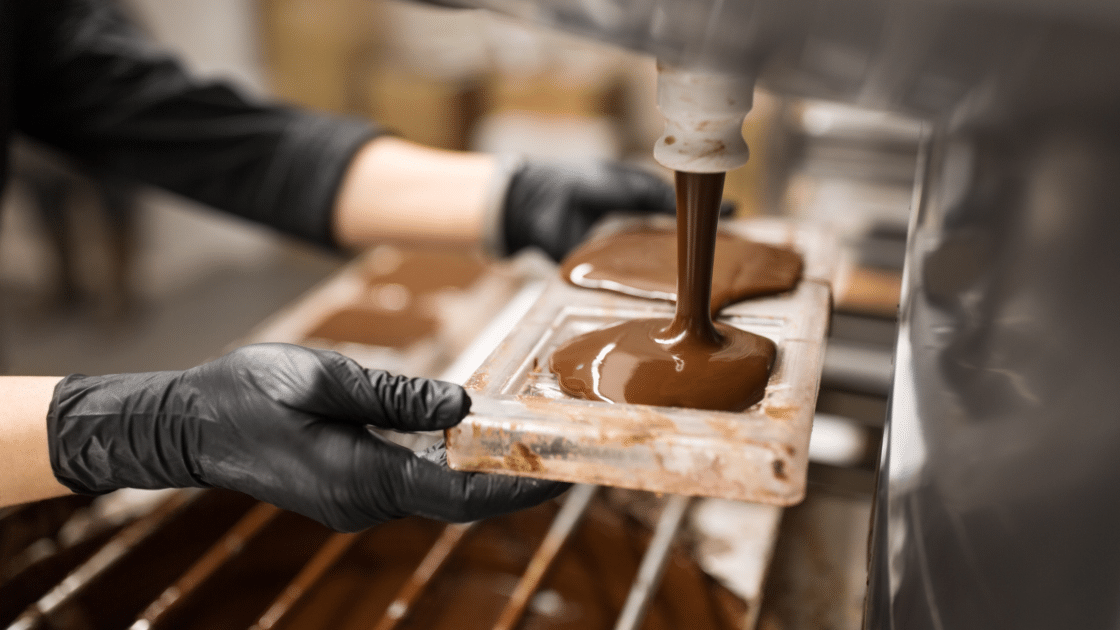
During conching, a chocolate mass undergoes continuous mechanical refining and mixing. This process reduces the size of cocoa’s solid particles and sugar crystals. It also gives the chocolate a smoother texture by reducing its graininess. Each batch’s journey requires a specific amount of energy to create the blend for the desired product. This could include mixing, refining, temperature control, viscosity control, and flavor development.

Problem
Engineers wanted to conserve energy by reducing batch cycle time. However, they had to ensure that the quality of the main recipe—Product C—was not compromised as a result of shorter batch cycles. They wanted to create an overview of all batches, find the most efficient, and replicate the result.
Goals
- Reduce batch cycle time of the conching process to conserve energy.
- Create a golden fingerprint with the ideal batch cycle time so it can be replicated and used for future batches.
Challenge
The information used to create the batch recipe had to be pulled from an external SQL database and added as contextual data.
Solution
- Connect to the external SQL database with the phases and batch data.
- Filter batches of a certain asset, recipe, and quality results if available, sort them by duration, and compare them to the saved portion of the time-series dataset.
- Verify that energy requirements, steam consumption, and other quality standards are met.
- Benchmark the most efficient batches to create a golden fingerprint for future production.
- Create a color-coded contextualized view that would allow users to easily see if energy consumption was much higher or much lower than normal.
Results
- Using TrendMiner’s Compare Table, engineers were able to pinpoint conching processes that were specifically related to Product C.
- They then found batches with the shortest cycle time and the best product quality.
- By using Layer Compare, they then identified the total amount of energy used by each batch.
- Finally, engineers found that they could run shorter batches for Product C that met energy requirements, and without reducing quality.
Value
- Batch cycle time on Product C reduced from 16 hours to 14 hours, or 12.5%.
- 1,800 hours, or about 2 ½ months, in added annual capacity.
Situation
During conching, a chocolate mass undergoes continuous mechanical refining and mixing. This process reduces the size of cocoa’s solid particles and sugar crystals. It also gives the chocolate a smoother texture by reducing its graininess. Each batch’s journey requires a specific amount of energy to create the blend for the desired product. This could include mixing, refining, temperature control, viscosity control, and flavor development.
Problem
Engineers wanted to conserve energy by reducing batch cycle time. However, they had to ensure that the quality of the main recipe—Product C—was not compromised as a result of shorter batch cycles. They wanted to create an overview of all batches, find the most efficient, and replicate the result.
Goals
- Reduce batch cycle time of the conching process to conserve energy.
- Create a golden fingerprint with the ideal batch cycle time so it can be replicated and used for future batches.
Challenge
The information used to create the batch recipe had to be pulled from an external SQL database and added as contextual data.
Solution
- Connect to the external SQL database with the phases and batch data.
- Filter batches of a certain asset, recipe, and quality results if available, sort them by duration, and compare them to the saved portion of the time-series dataset.
- Verify that energy requirements, steam consumption, and other quality standards are met.
- Benchmark the most efficient batches to create a golden fingerprint for future production.
- Create a color-coded contextualized view that would allow users to easily see if energy consumption was much higher or much lower than normal.
Results
- Using TrendMiner’s Compare Table, engineers were able to pinpoint conching processes that were specifically related to Product C.
- They then found batches with the shortest cycle time and the best product quality.
- By using Layer Compare, they then identified the total amount of energy used by each batch.
- Finally, engineers found that they could run shorter batches for Product C that met energy requirements, and without reducing quality.
Value
- Batch cycle time on Product C reduced from 16 hours to 14 hours, or 12.5%.
- 1,800 hours, or about 2 ½ months, in added annual capacity.
Access now
Share with a co-worker
Situation
During conching, a chocolate mass undergoes continuous mechanical refining and mixing. This process reduces the size of cocoa’s solid particles and sugar crystals. It also gives the chocolate a smoother texture by reducing its graininess. Each batch’s journey requires a specific amount of energy to create the blend for the desired product. This could include mixing, refining, temperature control, viscosity control, and flavor development.
Problem
Engineers wanted to conserve energy by reducing batch cycle time. However, they had to ensure that the quality of the main recipe—Product C—was not compromised as a result of shorter batch cycles. They wanted to create an overview of all batches, find the most efficient, and replicate the result.
Goals
- Reduce batch cycle time of the conching process to conserve energy.
- Create a golden fingerprint with the ideal batch cycle time so it can be replicated and used for future batches.
Challenge
The information used to create the batch recipe had to be pulled from an external SQL database and added as contextual data.
Solution
- Connect to the external SQL database with the phases and batch data.
- Filter batches of a certain asset, recipe, and quality results if available, sort them by duration, and compare them to the saved portion of the time-series dataset.
- Verify that energy requirements, steam consumption, and other quality standards are met.
- Benchmark the most efficient batches to create a golden fingerprint for future production.
- Create a color-coded contextualized view that would allow users to easily see if energy consumption was much higher or much lower than normal.
Results
- Using TrendMiner’s Compare Table, engineers were able to pinpoint conching processes that were specifically related to Product C.
- They then found batches with the shortest cycle time and the best product quality.
- By using Layer Compare, they then identified the total amount of energy used by each batch.
- Finally, engineers found that they could run shorter batches for Product C that met energy requirements, and without reducing quality.
Value
- Batch cycle time on Product C reduced from 16 hours to 14 hours, or 12.5%.
- 1,800 hours, or about 2 ½ months, in added annual capacity.
Access now
Subscribe to our newsletter
Stay up to date with our latest news and updates.
Other Webinars on Demand
Press Play on Operational Improvement

.jpg)
Other Resources
Explore Our Newest Content to Maximize Your Operational Efficiency