Share with a co-worker

Situation
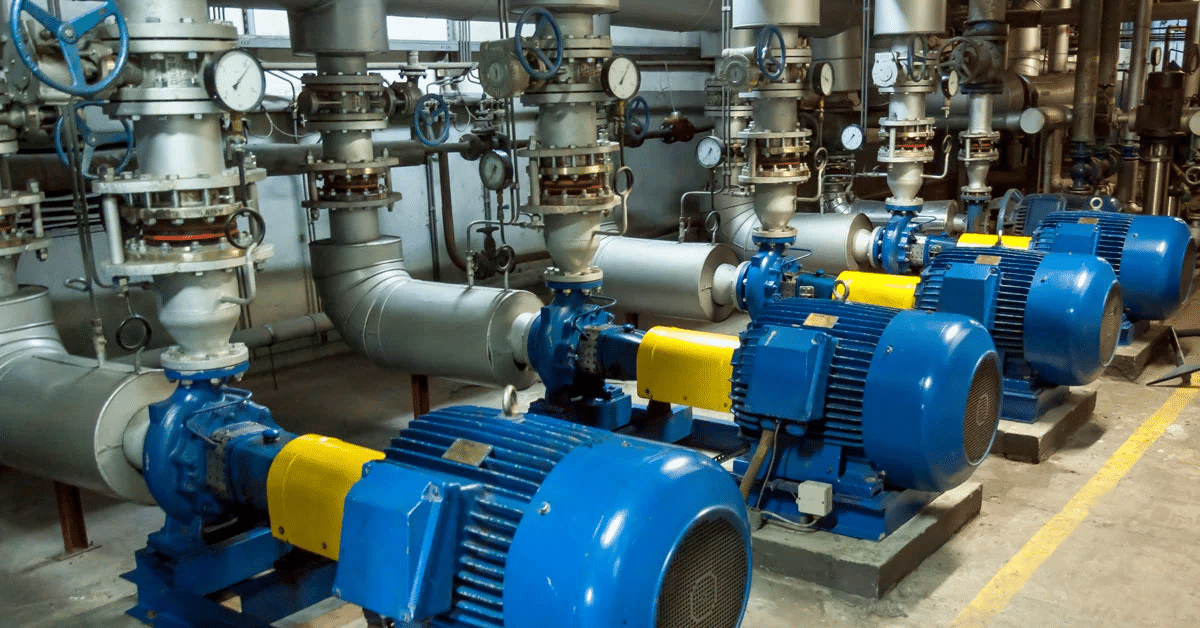
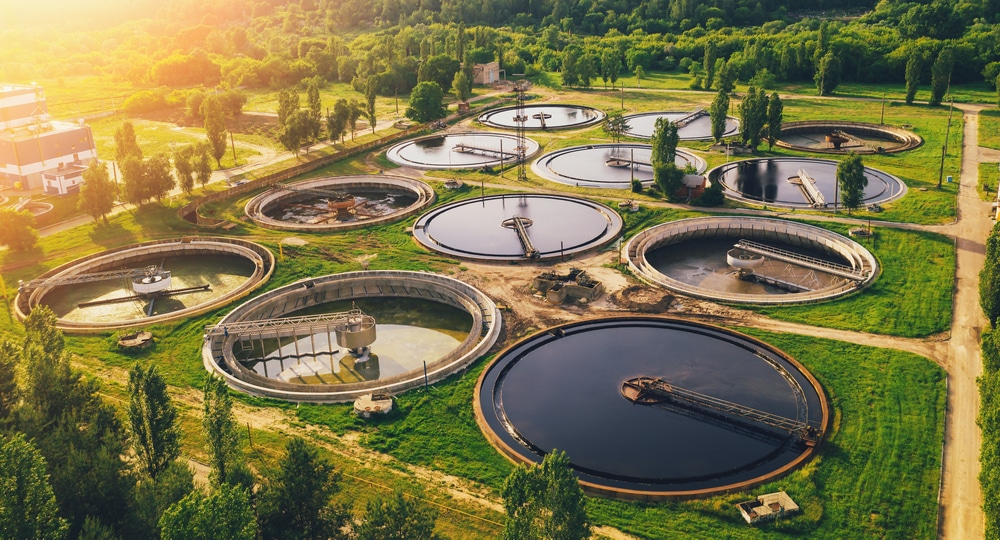
The blowers for fresh air injection at a wastewater treatment plant and pumps used for motility account for a large portion of the total energy consumed during the process. Process experts can create a dashboard with decisive process parameters and energy management goals. This details the distribution, expressed as a percentage, of the plant’s energy consumption and gives engineers a better overview of treatment performance and energy efficiency.
Problem
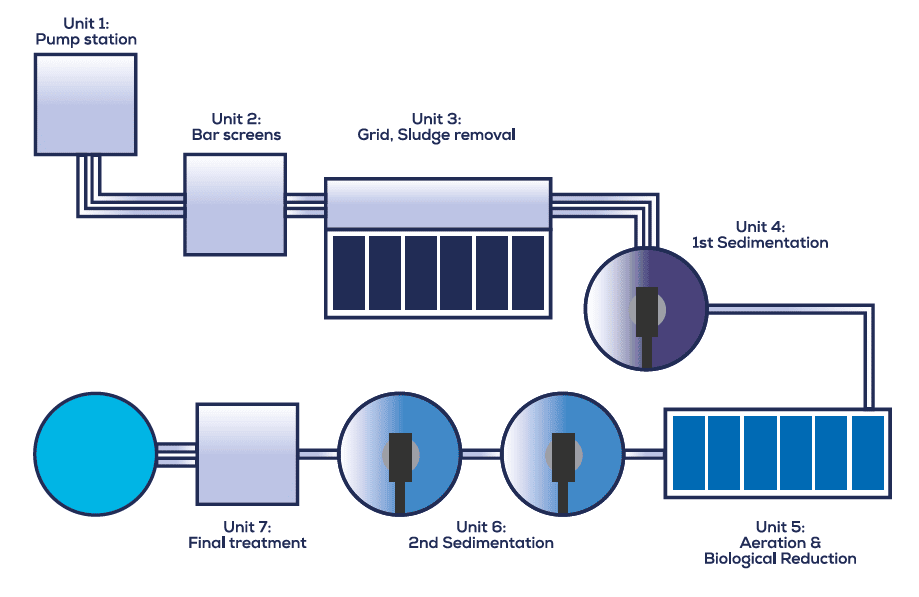
Engineers want to create a dashboard to have an overview of energy consumption throughout the plant. The dashboard needs to include the percentage of total energy consumption that each unit uses. These include pump stations, aeration tanks, and others. Process experts then would use the dashboard to evaluate periods of good and bad operation, and energy management anomalies that could result in excess power consumption. They also could use the dashboard to determine the main energy consumer. The energy performance tag is based on the correlation of the total energy and the treated wastewater stream.
Solution
Process experts created tags in TrendMiner to determine the percent of energy consumed by each unit. They then made a TrendHub dashboard view with the newly created tags that used color coding to differentiate areas of good, mediocre, and poor energy efficiency. A comparison of areas of good and poor energy performance shows that the percentage of revitalization is about 12% higher than during periods of poor energy performance.
Results
- The new dashboard gives process experts a fast and convenient way of creating and displaying new tags to get a better understanding of energy usage throughout the plant.
- The Live Energy Management Dashboard now serves as the energy management control center, where process experts use the dashboarding for startup routines and to provide live discovery of process anomalies or other deviations in normal operating behavior.
- A comparison of areas of good and poor energy efficiency shows that the percentage of revitalization is about 12% higher than during periods of poor energy efficiency.
- Engineers learn they can decrease energy consumption by saving one pump and blower with the same good degradation of the pollutant load.
Water & wastewater
Operational Performance Management
Downtime Reduction
Cost Reduction
Process Optimization
Plant Manager
Process Engineer
Situation
The blowers for fresh air injection at a wastewater treatment plant and pumps used for motility account for a large portion of the total energy consumed during the process. Process experts can create a dashboard with decisive process parameters and energy management goals. This details the distribution, expressed as a percentage, of the plant’s energy consumption and gives engineers a better overview of treatment performance and energy efficiency.
Problem
Engineers want to create a dashboard to have an overview of energy consumption throughout the plant. The dashboard needs to include the percentage of total energy consumption that each unit uses. These include pump stations, aeration tanks, and others. Process experts then would use the dashboard to evaluate periods of good and bad operation, and energy management anomalies that could result in excess power consumption. They also could use the dashboard to determine the main energy consumer. The energy performance tag is based on the correlation of the total energy and the treated wastewater stream.
Solution
Process experts created tags in TrendMiner to determine the percent of energy consumed by each unit. They then made a TrendHub dashboard view with the newly created tags that used color coding to differentiate areas of good, mediocre, and poor energy efficiency. A comparison of areas of good and poor energy performance shows that the percentage of revitalization is about 12% higher than during periods of poor energy performance.
Results
- The new dashboard gives process experts a fast and convenient way of creating and displaying new tags to get a better understanding of energy usage throughout the plant.
- The Live Energy Management Dashboard now serves as the energy management control center, where process experts use the dashboarding for startup routines and to provide live discovery of process anomalies or other deviations in normal operating behavior.
- A comparison of areas of good and poor energy efficiency shows that the percentage of revitalization is about 12% higher than during periods of poor energy efficiency.
- Engineers learn they can decrease energy consumption by saving one pump and blower with the same good degradation of the pollutant load.
Share with a co-worker
Subscribe to our newsletter
Stay up to date with our latest news and updates.
Other Webinars on demand
Explore Our Newest Content to Maximize Your Operational Efficiency
.jpg)
.jpg)
.jpg)
Other Resources
Explore Our Newest Content to Maximize Your Operational Efficiency