Share with a co-worker

Situation
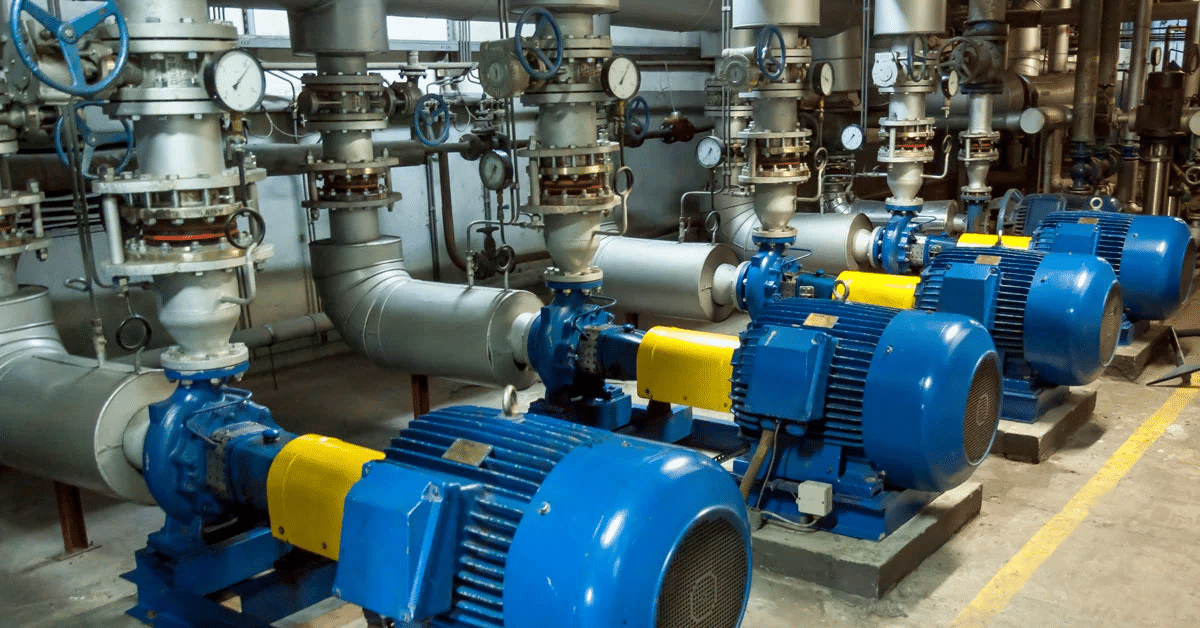
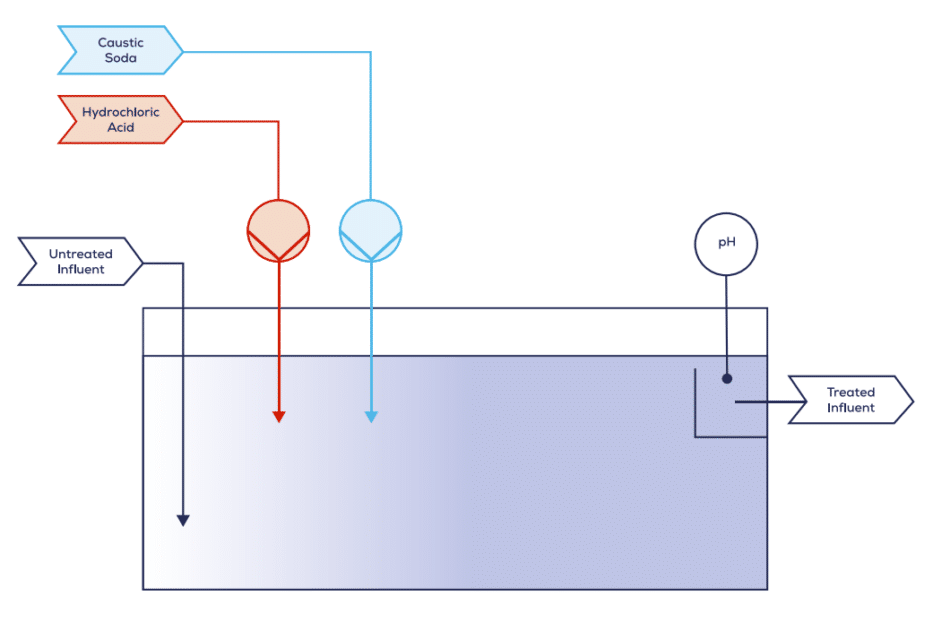
A steady supply of caustic soda and hydrochloric acid needs to be added to treated clean water leaving this plant to increase or decrease the pH level to the desired range. The hydrochloric acid not only is used to help with downstream regulatory compliance, but also prevents possible damage to equipment. It is transported via a pump in different quantities into the pH neutralization unit. The amount is determined by the pH sensor at the end of the unit.
Problem
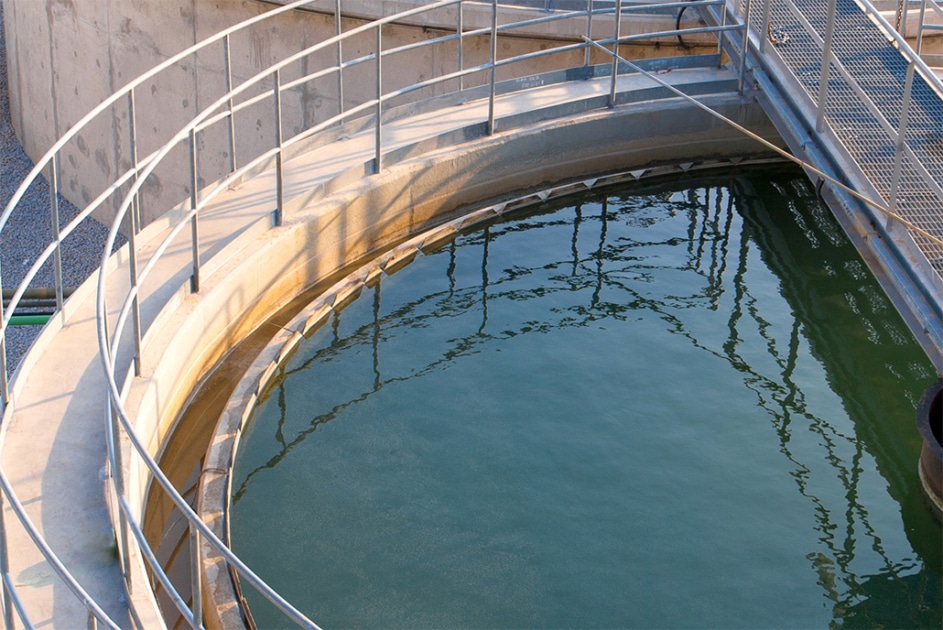
Treated clean water leaving the plant must comply with regulatory standards, including reducing concentrates of certain pollutants and neutralizing the pH value. In this case, the company had replaced the pipes for transporting hydrochloric acid during a maintenance and construction phase just prior to a visual analysis. After manually examining the deconstructed pipes, engineers determined that the pipes had been degrading for a long time.
Solution
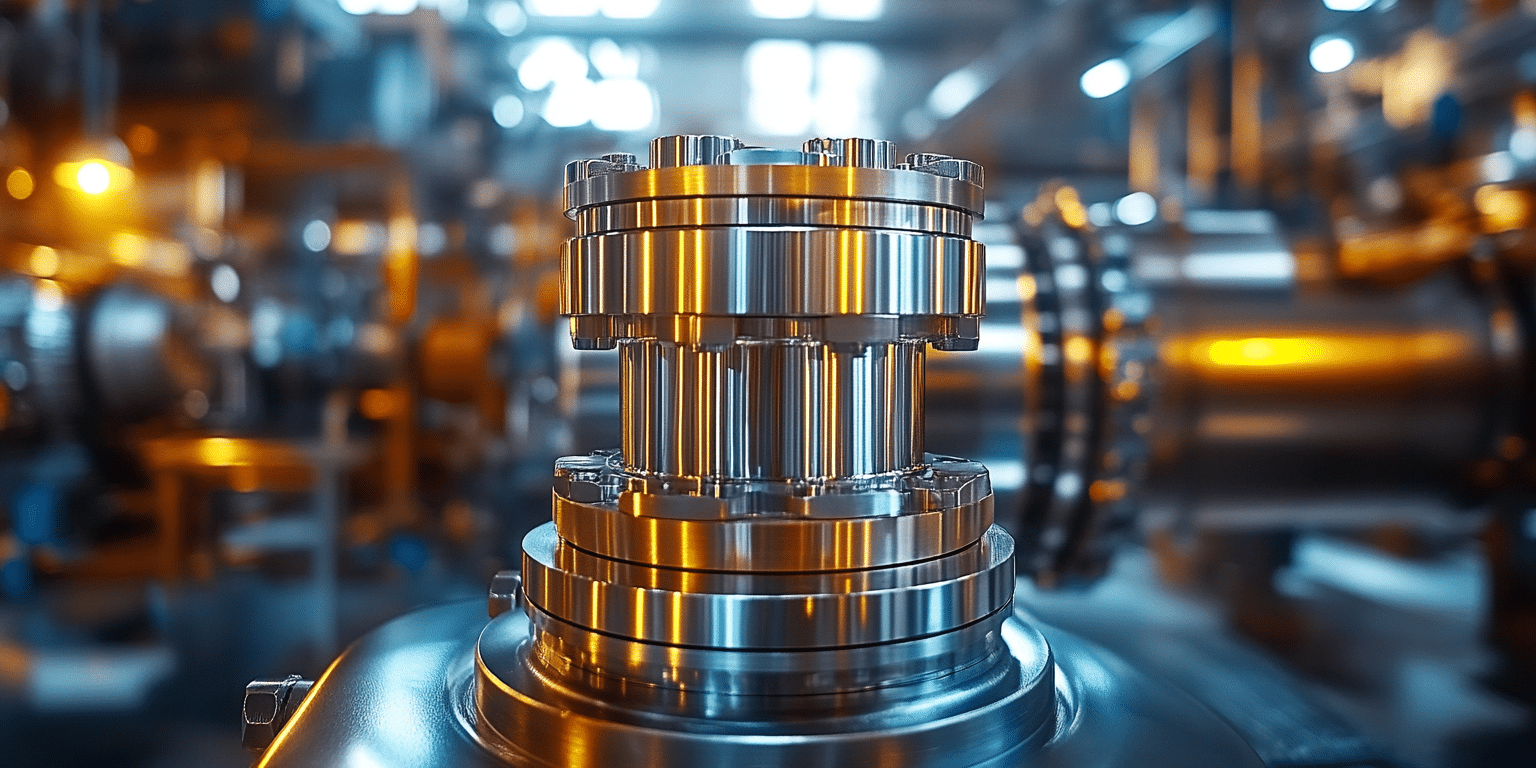
The first step was to evaluate the operation state of the hydrochloric acid pump. Pressure difference is a good indicator of a pump operation state, and therefore can be used as the basis for further analysis and monitoring. The next step was evaluating the relevant relationships within the pipe network. Process experts then could use this information to create a golden fingerprint from ideal operating conditions and set up monitoring and alert systems for anomaly detection.
Approach
- Evaluate the pump pressure over time to determine when flow rates decrease
- Determine the relationship between differential pressure the flow rate
- Create monitors and alerts when pump pressure and flow rate fall outside a specified range
Challenges
- Because the pressure difference monitor had a lot of noise, process experts had to use aggregation to smooth out the trend lines
- Process experts created a new tag in TrendMiner to differentiate between the pressures before and after the aggregation was applied
Results
- Engineers realized they were working with two operating conditions: One from before the maintenance, and one from after
- From those zones, engineers could see that friction in a pipe was significantly lower after construction than before
- Process experts used TrendMiner to create an ideal fingerprint for operational conditions within the pipe network
- The monitor not only detected friction but clogging, fouling, and significant leaks
- The company saved, money, time, and was able to comply with regulatory requirements
Water & wastewater
Operational Performance Management
Process Optimization
Plant Manager
Process Engineer
Situation
A steady supply of caustic soda and hydrochloric acid needs to be added to treated clean water leaving this plant to increase or decrease the pH level to the desired range. The hydrochloric acid not only is used to help with downstream regulatory compliance, but also prevents possible damage to equipment. It is transported via a pump in different quantities into the pH neutralization unit. The amount is determined by the pH sensor at the end of the unit.
Problem
Treated clean water leaving the plant must comply with regulatory standards, including reducing concentrates of certain pollutants and neutralizing the pH value. In this case, the company had replaced the pipes for transporting hydrochloric acid during a maintenance and construction phase just prior to a visual analysis. After manually examining the deconstructed pipes, engineers determined that the pipes had been degrading for a long time.
Solution
The first step was to evaluate the operation state of the hydrochloric acid pump. Pressure difference is a good indicator of a pump operation state, and therefore can be used as the basis for further analysis and monitoring. The next step was evaluating the relevant relationships within the pipe network. Process experts then could use this information to create a golden fingerprint from ideal operating conditions and set up monitoring and alert systems for anomaly detection.
Approach
- Evaluate the pump pressure over time to determine when flow rates decrease
- Determine the relationship between differential pressure the flow rate
- Create monitors and alerts when pump pressure and flow rate fall outside a specified range
Challenges
- Because the pressure difference monitor had a lot of noise, process experts had to use aggregation to smooth out the trend lines
- Process experts created a new tag in TrendMiner to differentiate between the pressures before and after the aggregation was applied
Results
- Engineers realized they were working with two operating conditions: One from before the maintenance, and one from after
- From those zones, engineers could see that friction in a pipe was significantly lower after construction than before
- Process experts used TrendMiner to create an ideal fingerprint for operational conditions within the pipe network
- The monitor not only detected friction but clogging, fouling, and significant leaks
- The company saved, money, time, and was able to comply with regulatory requirements
Share with a co-worker
Subscribe to our newsletter
Stay up to date with our latest news and updates.
Other Webinars on demand
Explore Our Newest Content to Maximize Your Operational Efficiency
.jpg)
.jpg)
.jpg)
Other Resources
Explore Our Newest Content to Maximize Your Operational Efficiency