Share with a co-worker

Situation
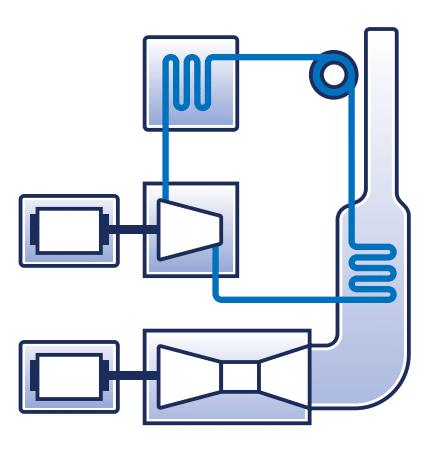
A plant in the energy & utilities industry uses natural gas to produce electricity. This combined-cycle gas power plant is equipped with two turbines that power a generator.
The primary turbine is powered by hot air, which is generated by burning the gas. The secondary turbine is powered by steam that is generated by heating up water with the air coming from the primary turbine
Problem
Over time, the performance of a unit of the plant’s power station began to worsen, leading to capacity loss and lost revenue. The loss was gradual, so the losses went unnoticed at first. After a couple of years, however, it became clear that performance was degrading. The team wanted to quantify the impact and duration of their losses, but before using TrendMiner they didn’t have the toolset do this efficiently
Solution
A decrease in performance is usually a gradual phenomenon that only comes to the surface after a long period of time. With TrendMiner, the team could clearly visualize operations over time. Using a value-based search, the decline in performance was quickly confirmed and quantified. This formed the foundation for the rest of their analysis.
Due to external factors such as unplanned downtime and load reduction on market demand, the team needed to dig deeper to measure the actual performance of the unit. To do this, the engineers used TrendMiner to identify which process parameters differed consistently between those two time periods to find a potential root cause of the decreased performance.
1. Comparison
Performance of the power station depends on the ambient temperature, so the team started by finding periods where the ambient temperature was relatively constant. A value-based search was performed to find periods where the ambient temperature is between 80°F and 83°F. They also filtered out periods where the plant was not running or the power was too low. Once this was completed, the average power production could then be calculated and exported for assessment. The results showed that the performance of the current power station indeed decreased about 2% over the course of 3 years.
“Comparison of good behaviour with periods of bad performance through use of the comparison table helped to identify the root cause of the performance losses”
2. Root Cause Analysis
Using TrendMiner’s layering functionality, good performance periods were selected from 2014, and bad performance periods were selected from 2015 and 2016. Using the layer comparison table, the engineers could identify potential root causes of the problem.
The team found that the gas fuel flow, the compressor discharge temperature and the inlet guide veins reference angle differ consistently for both groups of layers. The resulting observations lead to the hypothesis that the root cause of the problem could be explained due to non-calibrated inlet guide vanes, which impeded air and fuel supply and ultimately power generation in the gas turbine.
3. Knowledge Sharing
Using the annotations in TrendMiner, observations were captured and shared within the organization for the investigated periods. As a result, when an engineer goes back and looks at the production data, he will be made aware of the non-calibrated inlet guide vanes. He will know immediately that this data corresponds to sub-optimal operation, and why. Capturing valuable information guarantees the availability and distribution of knowledge, and will provide opportunities for organizations to enhance productivity and gain competitiveness.
Results
After years of reduced power production and tangible revenue losses, plant engineers needed to identify and resolve the issues at hand. Before TrendMiner, countless time was invested in meetings, discussions, and analysis using conventional tools and methods, but they were still unable to find answers. Leveraging the analytics capabilities of TrendMiner, they were able to efficiently identify and resolve the capacity loss. The improvement potential is around 2 Megawatts of extra production, resulting in an estimated $260K per year in business value.
4 Hours
Spent by the engineers for assessing and solving the use case, which would have cost days without the use of TrendMiner.
~$260K
Increase in business value due to identification of the root cause for capacity loss.
Oil & gas
Energy & natural resources
Asset Performance Management
Operational Performance Management
Asset Optimization and Monitoring
Process Optimization
Process Engineer
Reliability Engineer
Maintenance Engineer
Situation
A plant in the energy & utilities industry uses natural gas to produce electricity. This combined-cycle gas power plant is equipped with two turbines that power a generator.
The primary turbine is powered by hot air, which is generated by burning the gas. The secondary turbine is powered by steam that is generated by heating up water with the air coming from the primary turbine
Problem
Over time, the performance of a unit of the plant’s power station began to worsen, leading to capacity loss and lost revenue. The loss was gradual, so the losses went unnoticed at first. After a couple of years, however, it became clear that performance was degrading. The team wanted to quantify the impact and duration of their losses, but before using TrendMiner they didn’t have the toolset do this efficiently
Solution
A decrease in performance is usually a gradual phenomenon that only comes to the surface after a long period of time. With TrendMiner, the team could clearly visualize operations over time. Using a value-based search, the decline in performance was quickly confirmed and quantified. This formed the foundation for the rest of their analysis.
Due to external factors such as unplanned downtime and load reduction on market demand, the team needed to dig deeper to measure the actual performance of the unit. To do this, the engineers used TrendMiner to identify which process parameters differed consistently between those two time periods to find a potential root cause of the decreased performance.
1. Comparison
Performance of the power station depends on the ambient temperature, so the team started by finding periods where the ambient temperature was relatively constant. A value-based search was performed to find periods where the ambient temperature is between 80°F and 83°F. They also filtered out periods where the plant was not running or the power was too low. Once this was completed, the average power production could then be calculated and exported for assessment. The results showed that the performance of the current power station indeed decreased about 2% over the course of 3 years.
“Comparison of good behaviour with periods of bad performance through use of the comparison table helped to identify the root cause of the performance losses”
2. Root Cause Analysis
Using TrendMiner’s layering functionality, good performance periods were selected from 2014, and bad performance periods were selected from 2015 and 2016. Using the layer comparison table, the engineers could identify potential root causes of the problem.
The team found that the gas fuel flow, the compressor discharge temperature and the inlet guide veins reference angle differ consistently for both groups of layers. The resulting observations lead to the hypothesis that the root cause of the problem could be explained due to non-calibrated inlet guide vanes, which impeded air and fuel supply and ultimately power generation in the gas turbine.
3. Knowledge Sharing
Using the annotations in TrendMiner, observations were captured and shared within the organization for the investigated periods. As a result, when an engineer goes back and looks at the production data, he will be made aware of the non-calibrated inlet guide vanes. He will know immediately that this data corresponds to sub-optimal operation, and why. Capturing valuable information guarantees the availability and distribution of knowledge, and will provide opportunities for organizations to enhance productivity and gain competitiveness.
Results
After years of reduced power production and tangible revenue losses, plant engineers needed to identify and resolve the issues at hand. Before TrendMiner, countless time was invested in meetings, discussions, and analysis using conventional tools and methods, but they were still unable to find answers. Leveraging the analytics capabilities of TrendMiner, they were able to efficiently identify and resolve the capacity loss. The improvement potential is around 2 Megawatts of extra production, resulting in an estimated $260K per year in business value.
4 Hours
Spent by the engineers for assessing and solving the use case, which would have cost days without the use of TrendMiner.
~$260K
Increase in business value due to identification of the root cause for capacity loss.
Share with a co-worker
Subscribe to our newsletter
Stay up to date with our latest news and updates.
Other Webinars on demand
Explore Our Newest Content to Maximize Your Operational Efficiency
.jpg)
.jpg)
.jpg)
Other Resources
Explore Our Newest Content to Maximize Your Operational Efficiency