Share with a co-worker


Situation
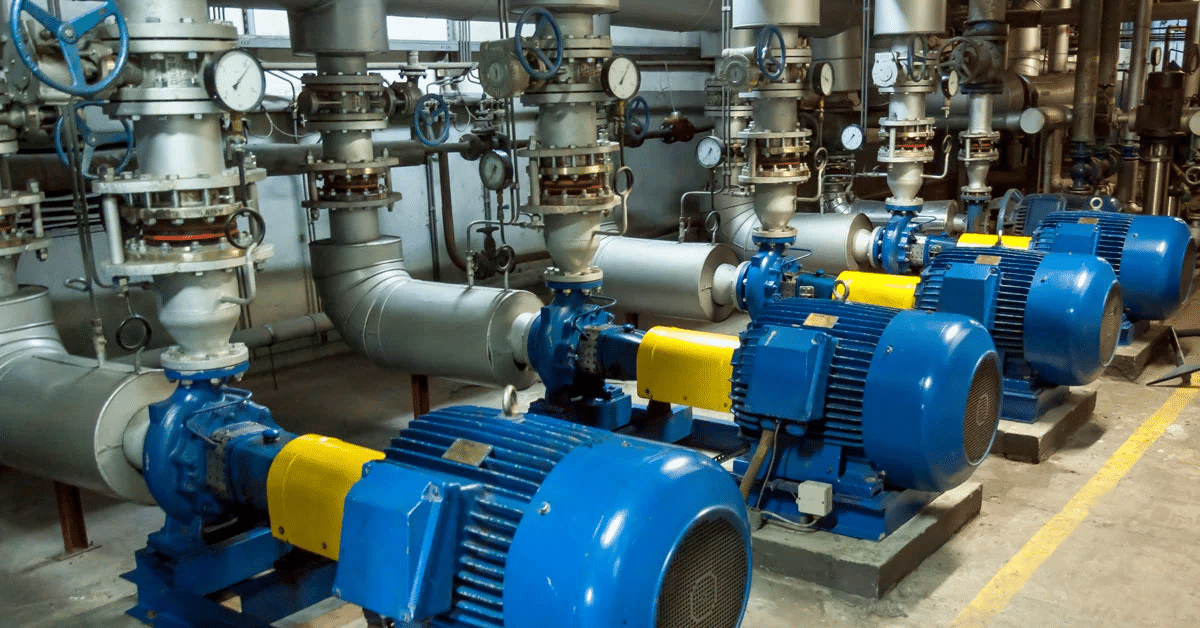
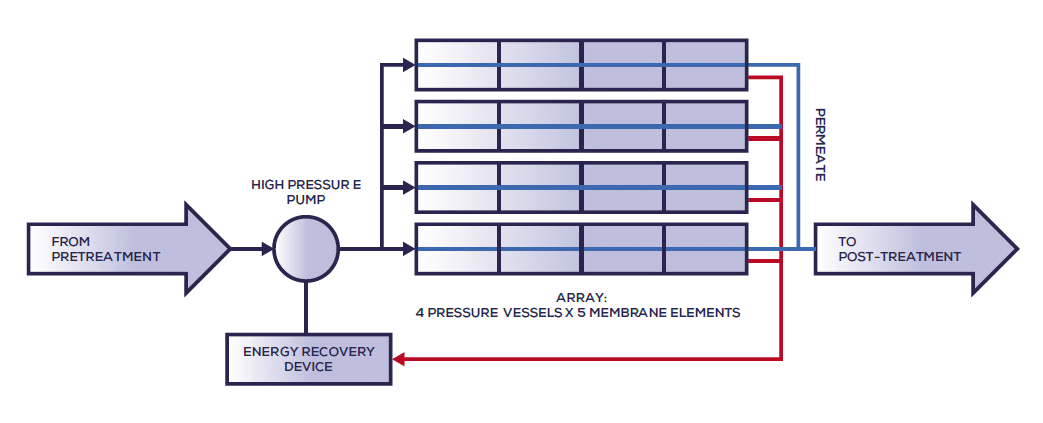
At this plant, demineralized water is produced. The water is demineralized using reverse osmosis, which involves using an external pressure to push the water through a semipermeable membrane against its chemical gradient. When this is done, the mineral contaminants are trapped and removed from the water. This process is intrinsically energy intensive and is best known for its application in desalination of seawater to produce fresh drinking water.
Problem
Due to government regulations, the plant receives fines as high as $2200 per month when their energy consumption exceeds certain limits. They had been receiving these fines on a frequent basis, so the process engineers sought to find ways to reduce energy consumption and avoid these unnecessary costs. In searching for a solution, a hypothesis was formed that the energy used to clean one liter of water depends on the number of reverse osmosis units running, but the team was unable to test this with conventional tooling. As a result, TrendMiner was used to investigate their hypothesis further.
Solution
With the goal of reducing fines in mind, the team needed to pinpoint the cause of their high energy use. To do this, they used various TrendMiner functionalities to test their hypothesis and gain insight into the relationship between the flow rate and the power usage.
1. Pre-Processing
To begin their analysis, tags were created in TrendMiner to measure and display the total power consumption of the reverse osmosis unit and the total flow of treated water. Now, the engineers could proceed to analyze the relationship between these two variables.
2. Data Vizualization
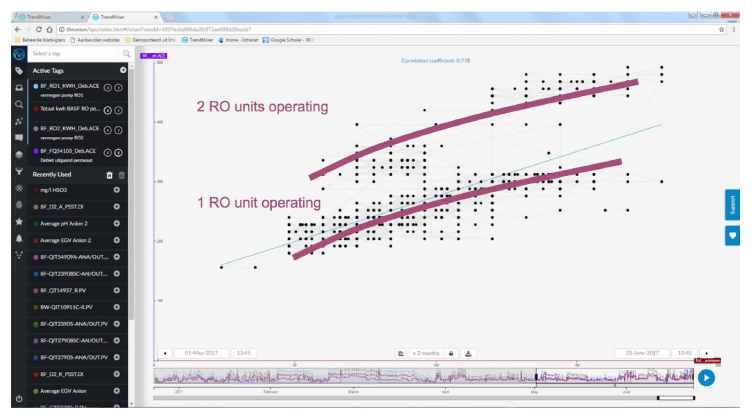
With the flow and energy consumption tags on display, a two-month timeframe was selected. This timeframe was selected due to the number of fines received in that period. The tags were visualized independently of time via a scatterplot with the flow in the y-axis and power consumption in the x-axis. Following these steps, the team was presented with the graph.
3. Data Analytics
Two different operation zones were very noticeable in the graph, and the team quickly came to two conclusions. Total energy consumption increased for the total amount of treated water, but the energy efficiency was different for producing with either one or two reverse osmosis skids. Power usage was much lower when operating with two reverse osmosis skids, especially at high production rates. With this information in hand, the team gained this valuable insight into their operations and the optimal number of reverse osmosis units for their process.
Results
Through their work in TrendMiner, the team finally determined that there was a dependency between energy consumption and the number of pumps/skids running in parallel. As a result, they were able to achieve their goal of reducing their energy use. By optimising the number of reverse osmosis units for a given flow, the team will save energy, reduce fines, and save costs. This is especially impactful during winter months when energy usage limits were exceeded most often.
2 Hours
In only 2 hours the engineers gained valuable insight in their operations and improve their production process.
Reduce Financial Penalties
Through optimization of the production process the energy consumption could be kept below the maximum limit to avoid financial penalties.
Water & wastewater
Asset Performance Management
Asset Optimization and Monitoring
Cost Reduction
Continuous Process Improvement
Process Engineer
Maintenance Engineer
Reliability Engineer
Automation Engineer
Operator
Quality Engineer
Situation
At this plant, demineralized water is produced. The water is demineralized using reverse osmosis, which involves using an external pressure to push the water through a semipermeable membrane against its chemical gradient. When this is done, the mineral contaminants are trapped and removed from the water. This process is intrinsically energy intensive and is best known for its application in desalination of seawater to produce fresh drinking water.
Problem
Due to government regulations, the plant receives fines as high as $2200 per month when their energy consumption exceeds certain limits. They had been receiving these fines on a frequent basis, so the process engineers sought to find ways to reduce energy consumption and avoid these unnecessary costs. In searching for a solution, a hypothesis was formed that the energy used to clean one liter of water depends on the number of reverse osmosis units running, but the team was unable to test this with conventional tooling. As a result, TrendMiner was used to investigate their hypothesis further.
Solution
With the goal of reducing fines in mind, the team needed to pinpoint the cause of their high energy use. To do this, they used various TrendMiner functionalities to test their hypothesis and gain insight into the relationship between the flow rate and the power usage.
1. Pre-Processing
To begin their analysis, tags were created in TrendMiner to measure and display the total power consumption of the reverse osmosis unit and the total flow of treated water. Now, the engineers could proceed to analyze the relationship between these two variables.
2. Data Vizualization
With the flow and energy consumption tags on display, a two-month timeframe was selected. This timeframe was selected due to the number of fines received in that period. The tags were visualized independently of time via a scatterplot with the flow in the y-axis and power consumption in the x-axis. Following these steps, the team was presented with the graph.
3. Data Analytics
Two different operation zones were very noticeable in the graph, and the team quickly came to two conclusions. Total energy consumption increased for the total amount of treated water, but the energy efficiency was different for producing with either one or two reverse osmosis skids. Power usage was much lower when operating with two reverse osmosis skids, especially at high production rates. With this information in hand, the team gained this valuable insight into their operations and the optimal number of reverse osmosis units for their process.
Results
Through their work in TrendMiner, the team finally determined that there was a dependency between energy consumption and the number of pumps/skids running in parallel. As a result, they were able to achieve their goal of reducing their energy use. By optimising the number of reverse osmosis units for a given flow, the team will save energy, reduce fines, and save costs. This is especially impactful during winter months when energy usage limits were exceeded most often.
2 Hours
In only 2 hours the engineers gained valuable insight in their operations and improve their production process.
Reduce Financial Penalties
Through optimization of the production process the energy consumption could be kept below the maximum limit to avoid financial penalties.
Share with a co-worker
Subscribe to our newsletter
Stay up to date with our latest news and updates.
Other Webinars on demand
Explore Our Newest Content to Maximize Your Operational Efficiency
.jpg)
.jpg)
.jpg)
Other Resources
Explore Our Newest Content to Maximize Your Operational Efficiency