


TrendMiner allows you to navigate data from all of your production systems, wherever you are. It's your own powerful trend client to look at data, annotate findings and compare time periods.


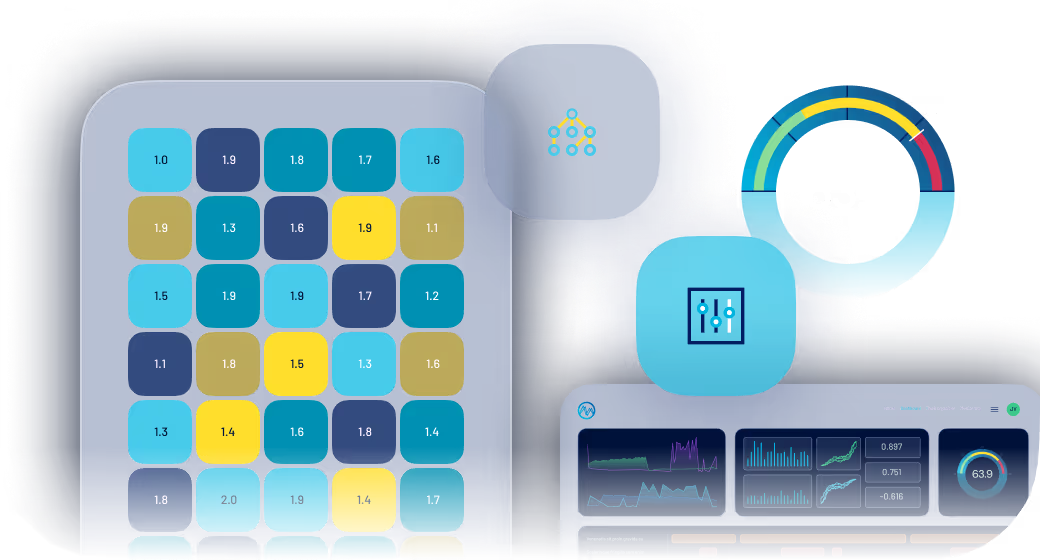
Analytics


Time-series analysis means being able to search through years of data and look for patterns, multi-variate conditions or relationships to find answers. If you need help, let TrendMiner search for correlations across your entire dataset.

Tracking behavior from assets or processes can be difficult. Create visual fingerprints that can be visually tracked on dashboards, or run automated detections in the background 24/7.

Creating your own formulas, aggregations or machine learning models with an easy to use interface. Usable like any other time-series signal.

Add valuable insights with calculated features on top of your data. Your enhanced data set is then ready for use in visualizations and filters.


Share your insights and solutions with other users. Dashboards can serve as an environment to build out solutions that can be shared with teams or as daily, weekly, monthly reporting views.

Keep operations running smooth 24/7 without boots on the ground. Let TrendMiner Monitoring keep an eye on things, continuously enhancing the data layer and alerting teams when problems arise to take action.
The key to getting results is getting access to a 360-view on data. TrendMiner connects OT, IT, human knowledge and asset data together in its Enhanced Data Layer.
Enrich raw data from time-series data sources by adding layers of metadata like time-stamps, calculated features and classifications to your dataset. This provides a layer of knowledge, making data readable for more people and ready for analytics. Best of all, it's automated, for continuous value.
Let monitors automatically deliver alerts to mailboxes, notification centers or 3rd party applications. All with the right information to let users take action and dive into the data with a single click.

Scaling


One-offs are not enough. Bring your project outcomes made on a local level to locations globally. Wether you share a predictive detection model with other plants or a weekly production report template with another team. Every item of work in the platform is shareable.
We make it easy to replicate your work across similar assets. Duplicate searches, formulas, views and reports and remap variables to represent different assets.


COLLABORATION

Manage access to important views, let multiple people edit the same item, and share your reports with groups of people that need to get eyeballs on it.

Leave important information or get help from other users. Comments let you keep critical momentum within your team.


Advanced analytics & Code

Build graphs from your dataframes with the most popular visualization libraries like Matplotlib, Plotly and Seaborn. Graphs with live updates can be included in your personal dashboards to complete your story.
Do inferencing, in the tools you prefer. Bring results from 3rd party MLOps platforms to TrendMiner. Scale classifications, anomaly detections and forecasts in tools like Databricks, and bring results back to the TrendMiner platform.

Prepare, cleanse and enhance data by working with your TrendMiner time-series and event data in our Python environment as dataframes. From there you can enjoy full flexibility to build insights.
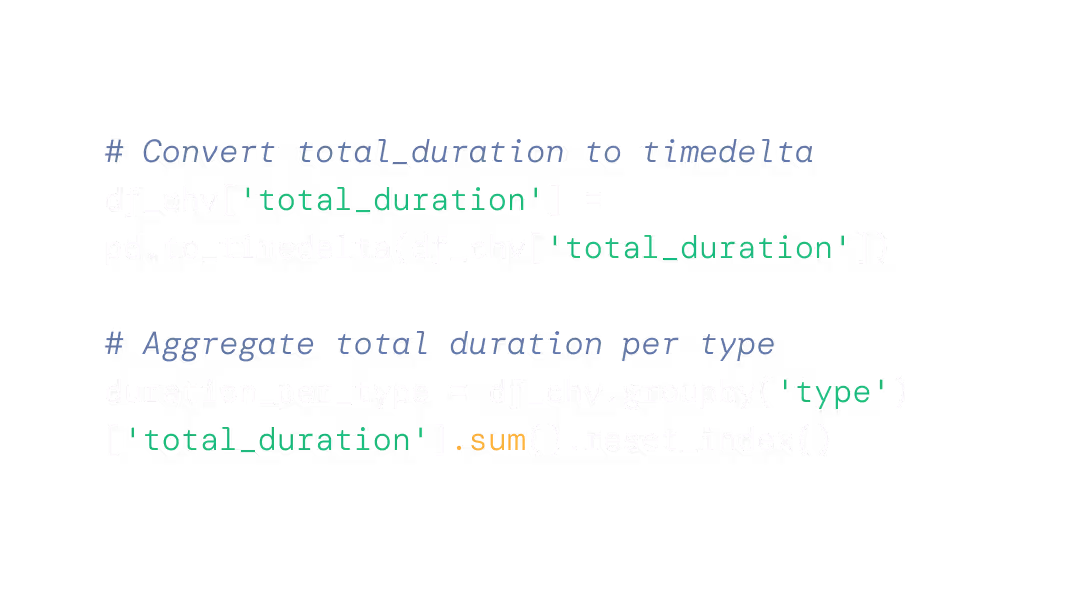
Leverage your full code environment to build business logic that helps you create calculations, automated classification fields or forecast values using your favorite machine learning model.


